Fortum is a Nordic energy company with a mission to power a world where people, businesses, and nature thrive together. As one of the cleanest energy producers in Europe, Fortum's actions are guided by ambitious environmental targets. The company generates and delivers clean energy reliably and helps industries decarbonize their processes and grow. Core operations in the Nordics include efficient, CO2-free power generation and the reliable supply of electricity and district heat to private and business customers.
When Conversionista partnered with Fortum, we identified significant opportunities to enhance their data-driven approach. The team lacked a clear understanding of the user journey, pain points, and optimization priorities. Despite having numerous ideas, there was no process to measure the impact of these ideas. This is where Conversionista stepped in.
Our goal was to establish a data-driven culture with analytics at its core. We helped Fortum build a process to convert ideas into testable hypotheses using data triangulation. We prioritized A/B testing due to limited traffic and resources, ensuring thorough post-test analysis for maximum insights.
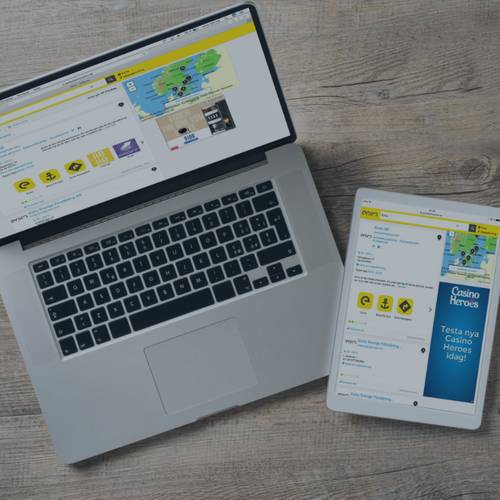
We collaborated with Fortum to run an A/B test on the price page within the purchase flow. The objective was to redesign the pricing blocks to clarify discounts and streamline information delivery. The primary KPI was the click-through rate, with additional tracking of user interactions with price details.

Why CTR as the main KPI? A site may have too little traffic to achieve a significant result in conversion rate/revenue. So measuring if the user proceeds to the next step in the funnel is key!
The first A/B test resulted in a -9% click-through rate, indicating a need for deeper analysis.
Deep-Dive Analysis Process
Price Details Interaction:

The analysis suggested that while the variant made price details easier to find, the modal interaction hindered user progression. We redesigned the variant to retain the drop-down function, enhancing clarity with improved copy and color usage. The subsequent test with these changes yielded a +9% increase in the click-through rate.

Deep analysis is essential for extracting maximum value from A/B testing, guiding informed decision-making and driving continuous improvement in user experience and digital performance.


Ready to accelerate your digital growth? Add your details here or email us at hej[a]conversionista.se and we’ll get back to you.