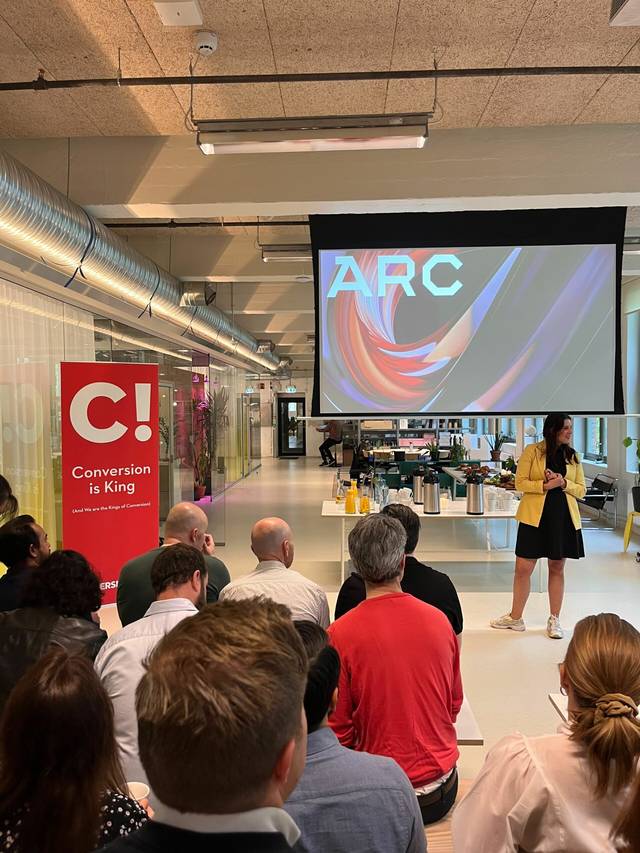
On a sunny Wednesday (24.5), Conversionista hosted a breakfast seminar where we were visited by CRO expert Andreas Gref (or AG as he calls himself) from Conversionista Sweden. He told and showed engaged attendees how they helped Kronans Apotek increase profitability by an impressive 11% through experimentation. At the same time, they managed to increase the choice of green shipping options by 25%. Below you will find key takeaways from the seminar, as well as an edited video recording of the session.
AG encourages participants to start thinking about experimentation.
Kronans Apotek is an offline and online pharmacy with stores all over Sweden. For online orders, they offer several different shipping options. When Kronans Apotek contacted Conversionista last fall, they wanted help increasing profitability in the online store. Like many other online stores, they experienced pressure on margins. Kronans Apotek challenged Andreas and his team to come up with a solution where they could charge for shipping and increase the number of green deliveries.
Most of the pharmacy's revenue comes from non-prescription medicines. Like many other companies, they found that the shipping options they offered were not profitable enough. When they deducted the shipping cost from the profit margin on a single order, they saw that many orders were net negative. In other words - when the customer places an order, it results in a loss for Kronans Apotek.
So when optimizing for shipping price - what do you do?
What Kronans primarily did was look at their competitors and conduct competitor analyses. They have done this systematically for a long time. Every week, they check all their competitors, see what shipping options they have, what the thresholds for free shipping are, and how much they charge if the customer is below the shipping threshold. And if any competitors make a change, Kronans has to decide whether to make a change as well. That was the method they worked by.
And, what parameters did they measure? Everything was measured against conversion rate and average order value. But were these the right metrics to measure against?
Where Does Conversionista Come In?
Andreas and his team started the project by conducting surveys on the website and a typical funnel analysis. They quickly saw that something was off. To get closer to the truth, they conducted an A/B test for 3 days where they removed the free shipping option. The result was that conversion actually went down, while the average order value went up. Here they got the first indications that things started to happen when they messed with the shipping prices.
In the next step, they set up matrix testing, where they tested many combinations of free shipping thresholds and actual prices. Not to get statistically significant answers, but rather to get indications of which direction the tests were pointing. They began to see a pattern, a pattern that gave larger and larger effects. They also saw that the experiment results were contrary to what people answered in the surveys. People say one thing but do another. This is not new in the CRO world, but here the team saw that the combination of surveys and competitor analysis was not the right approach.
But What Now? How Would They Get Decision-Ready Insights?
Andreas and his team defined the following parameters they could work with for the shipping options in the checkout:
Then they had to boil it down to a tighter experiment where these 4 options were considered and tested without noise from other variables.
And then there was the matter of goals. Remember that Kronans Apotek wanted to start charging for shipping and increase the share of green deliveries. And, that conversion rate and average order value were used as metrics in the pursuit of increased profitability. They had an expressed goal that they wanted Conversionista to optimize for, but with KPIs that couldn't measure this.
Andreas' team therefore transformed the mentioned goals into new metrics or values. And they became these, in ranked order:
This again meant that they needed new data. Typically, product margin, as well as shipping and handling costs, are often missing when looking at net profit. Fortunately, they got the numbers from other departments.
Then they had everything they needed to start the experiment.
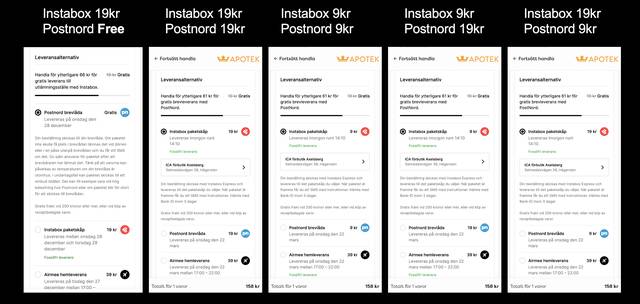
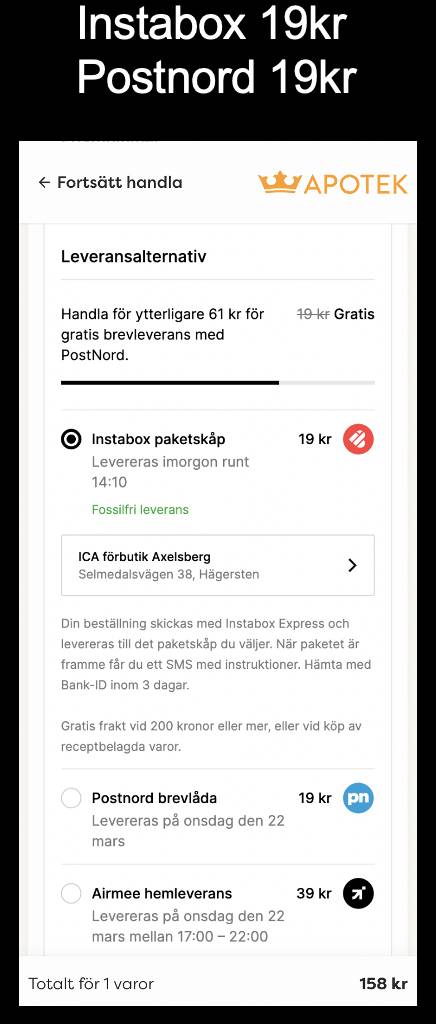
In short, they tested with an original version where one option was always free shipping - regardless of the order size. The shipping providers included in the test were Postnord and Instabox to narrow it down to something manageable in scope but still cover as many orders as possible. They then created a number of variants and increased the free shipping threshold to 199 SEK, regardless of the shipping option. For all variants to be pre-selected, Postnord and Instabox switched places in the test. Of course, they could have tested different variants where the order was different, but Andreas' team knew with great certainty that when something is pre-selected, the share of that option increases. And they also wanted to increase the share of green deliveries. These price combinations were tested:

After two weeks of experimentation, they had reached about 100,000 visitors in the checkout and about 60,000 transactions.
When the results came in, one variant stood out:

The option with the most expensive shipping alternatives resulted in a drop in conversion rate - 14%! Usually, the customer would shout "stop, stop, roll back." But it wasn't conversions they were supposed to measure against! At the same time, they saw that the number of orders that were net negative fell by -74%!
When they summed it up, they saw that the decrease in conversion rate and orders resulted in an increased net profit of 11% and a 2% increase in revenue. At the same time, they increased the share of green shipping options by 25%.
So the big question is: Can you figure this out without doing it through experimentation? The short answer is no. There is too much noise and too many parameters to control.
10 Good Tips for Doing Such Experimentation Yourself:
What If A/B Testing Can't Be Done?
Sometimes A/B testing is not the best option. There may be legal reasons, ways visitors communicate with each other, or other considerations to take into account.
You can then use two other test methods; Painted door test and switchback experiment.
A switchback experiment is a bit like it sounds. You turn the control and variant on and off, but they are never running simultaneously. This type of experimentation is good to use when:
A painted door test is a test where you introduce an element or feature that does nothing but measures how many try to interact with it. This way, you can find out if something is worth pursuing and developing.
NEED HELP WITH YOUR EXPERIMENTATION? CONTACT US FOR A NON-BINDING CHAT.