Let's start by defining our problem. An A/B test can have three types of results:
When talking about "win rate," we mean the proportion of your total tests that produce a winner.

What win rate should you expect?
We usually say that most companies and organizations have a win rate of about 30%. We have encountered very few (if any) that consistently deliver a win rate of over 50%.

Those who test a lot and are very good at testing also have very optimized sites, after several years of continuous optimization work. This means that they find it even harder to produce new winners because they have already squeezed out most of the potential from their sites.
Well – that wasn't fun to hear. It does feel a bit sad to try to sell this thing with A/B testing and secure a reasonable budget with the core message that two-thirds of what we do will fail - which boss gets excited about that?!
Now we come to the next step in the reasoning. We also say that "The only losing test is the one you didn't learn anything from." Even if a test delivers a negative result initially, it can deliver new valuable insights that inspire new tests, product development, or something else that ultimately delivers a positive result for the business.
That sounds great, but….
When we then go to the boss and say that you shouldn't focus on these 30% winners, but instead see all these other good things too – then we are on thin ice.
Why?
Because we have preached "data-driven" to the whole organization.
- "Stop making decisions based on gut feeling, trust the data."
But then we come and say that it should apply to everything except our own results, where the data says 30% winners, and then we try to top it up with some loose fluff like:
- "Yes, but we learned a lot of other good things too."
"A/B testers speak with a forked tongue," thinks the boss. Something like this:

Or maybe like this:

So now we have a choice. Either we can try to change the boss, or we can change how we follow up and present our results. And then I think like this:
"If you can’t change the player, change the game"
At its core, our problem is that we have clear results at both ends of our spectrum: Clear winners and clear losers. But then we have a lot of ambiguity in the middle. So if we could just make some of the ambiguous results clear, much would be gained. Let's try.
"The only losing test is the one you didn't learn anything from"
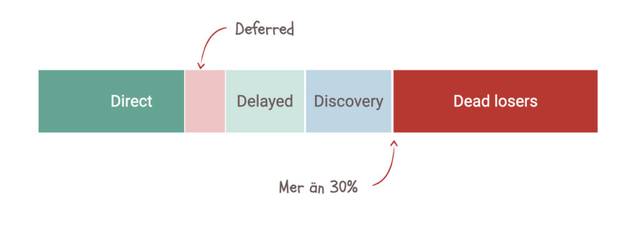
In the 5D model, we have created five classes of test results: Direct, Delayed, Discovery, Dead loser and Deferred.
Direct – A test result that shows a direct winner. A clear positive effect that we can implement immediately. These are the approximately 30% that we count as winners in our original model.
Delayed – This is a test that does not deliver a winner on the first try, *but* we get some ideas that we turn into follow-up tests and eventually get a winner. All tests on the way to our final win are now not counted as losers but as "delayed winners."
Discovery – Here we have a test that led to an insight that we then turned into a related positive result. It doesn't have to be a follow-up A/B test, but really anything that originated from our test and that we then applied to create a positive effect - any effect.
Dead loser – This is a loser that we have not been able to "raise from the dead." No matter how we try to tweak and do follow-up tests, we never get a winner. We have also not managed to create any other valuable insights from the tests. The test does not deliver any reasonable results, and we don't know why.
The first four categories are much about what are the *direct immediate* results of our tests. And then our results look like this:

Great, now the proportion of positive results has increased!
The next category is about what happens next.
Many organizations have problems implementing the positive test results they have created. It may be due to problems in the IT organization or how the backlog is prioritized. It can also be seen as you are testing the wrong things because what you are testing is not "implementable." Therefore, the last category is about the tests that were winners but were not implemented.
Deferred – Direct winners that were not implemented within the measurement period.

This may seem complicated, so let's illustrate with some concrete examples.
Let's say you want to test the copy on a call to action button on your page.
Today it says "Start subscription". You think it's a bit too little action in your call to action, so you want to test the text "Get started today". A bit more punch and "here and now," simply.
You test it and get 10% fewer conversions.
Now you think that maybe you were a bit too aggressive and maybe should do the exact opposite?! Maybe visitors need to inform themselves a bit more before making a decision, so you test – "See options".
You test it and get 5% more conversions – wohoo!
With the old way of counting, the result would have been:
Test 1 – Loser
Test 2 – Winner
Win rate = 50%
With the new way of counting, the result is:
Test 1 – Delayed
Test 2 – Direct
Win rate = 100%
Inspired by your success, you now go on to test more things. You consider making the form a bit simpler by removing the field for the customer's phone number.
One less thing to fill in => Higher conversion rate?!
You test it and see – no difference!
You then decide to keep the field. No difference in conversion rate, but valuable to get the customer's phone number if it doesn't cost anything. This is a test result of the type "Discovery." No direct result in the test, but a subsequent positive effect as a result of the test.
With the old way of counting, the result would have been:
Test 1 – Loser
Win rate = 0%
With the new way of counting, the result is:
Test 1 – Discovery
Win rate = 100%
What we have done with this new "counting method" is to reclassify some of our previous losers so that they are now counted as real winners instead of a vague "a loser, but…..".
Now we have a new way of counting. The next step is to set new goals for our work. Previously, our goal was: "Highest possible win rate." It still is – but we have a new way of counting our winners.
But I think it becomes even more interesting if you turn it around. The highest win rate is the same as the lowest possible "lose rate." And now our losers are only those that are "Dead losers."
Think about it. Is there any difference if you work to:
I am quite sure that two testing programs striving for these two different goals will look quite different.
So your new goals are now:
Goal 1: Minimize the proportion of "Dead losers"
And the second goal is about your "implementation rate," i.e., how many of your direct wins are actually implemented.
Goal 2: Maximize the proportion of implemented "Direct wins"
We hope that this new way of counting and following up on your successes can lead to more successes and, above all, a clearer way of communicating in your organization and a better understanding of the optimization work.
Don't hesitate to contact me and us if you agree, or even more interestingly - don't agree - or just want to discuss this model.